A global spatial library
Define your product, processes and data requirements.
Encode them into Giraffe, with custom parameters and interfaces.
Distribute these tools and datasets with the teams that can leverage them: acquisitions, design, marketing.
Iterate, improve, scale, accelerate.

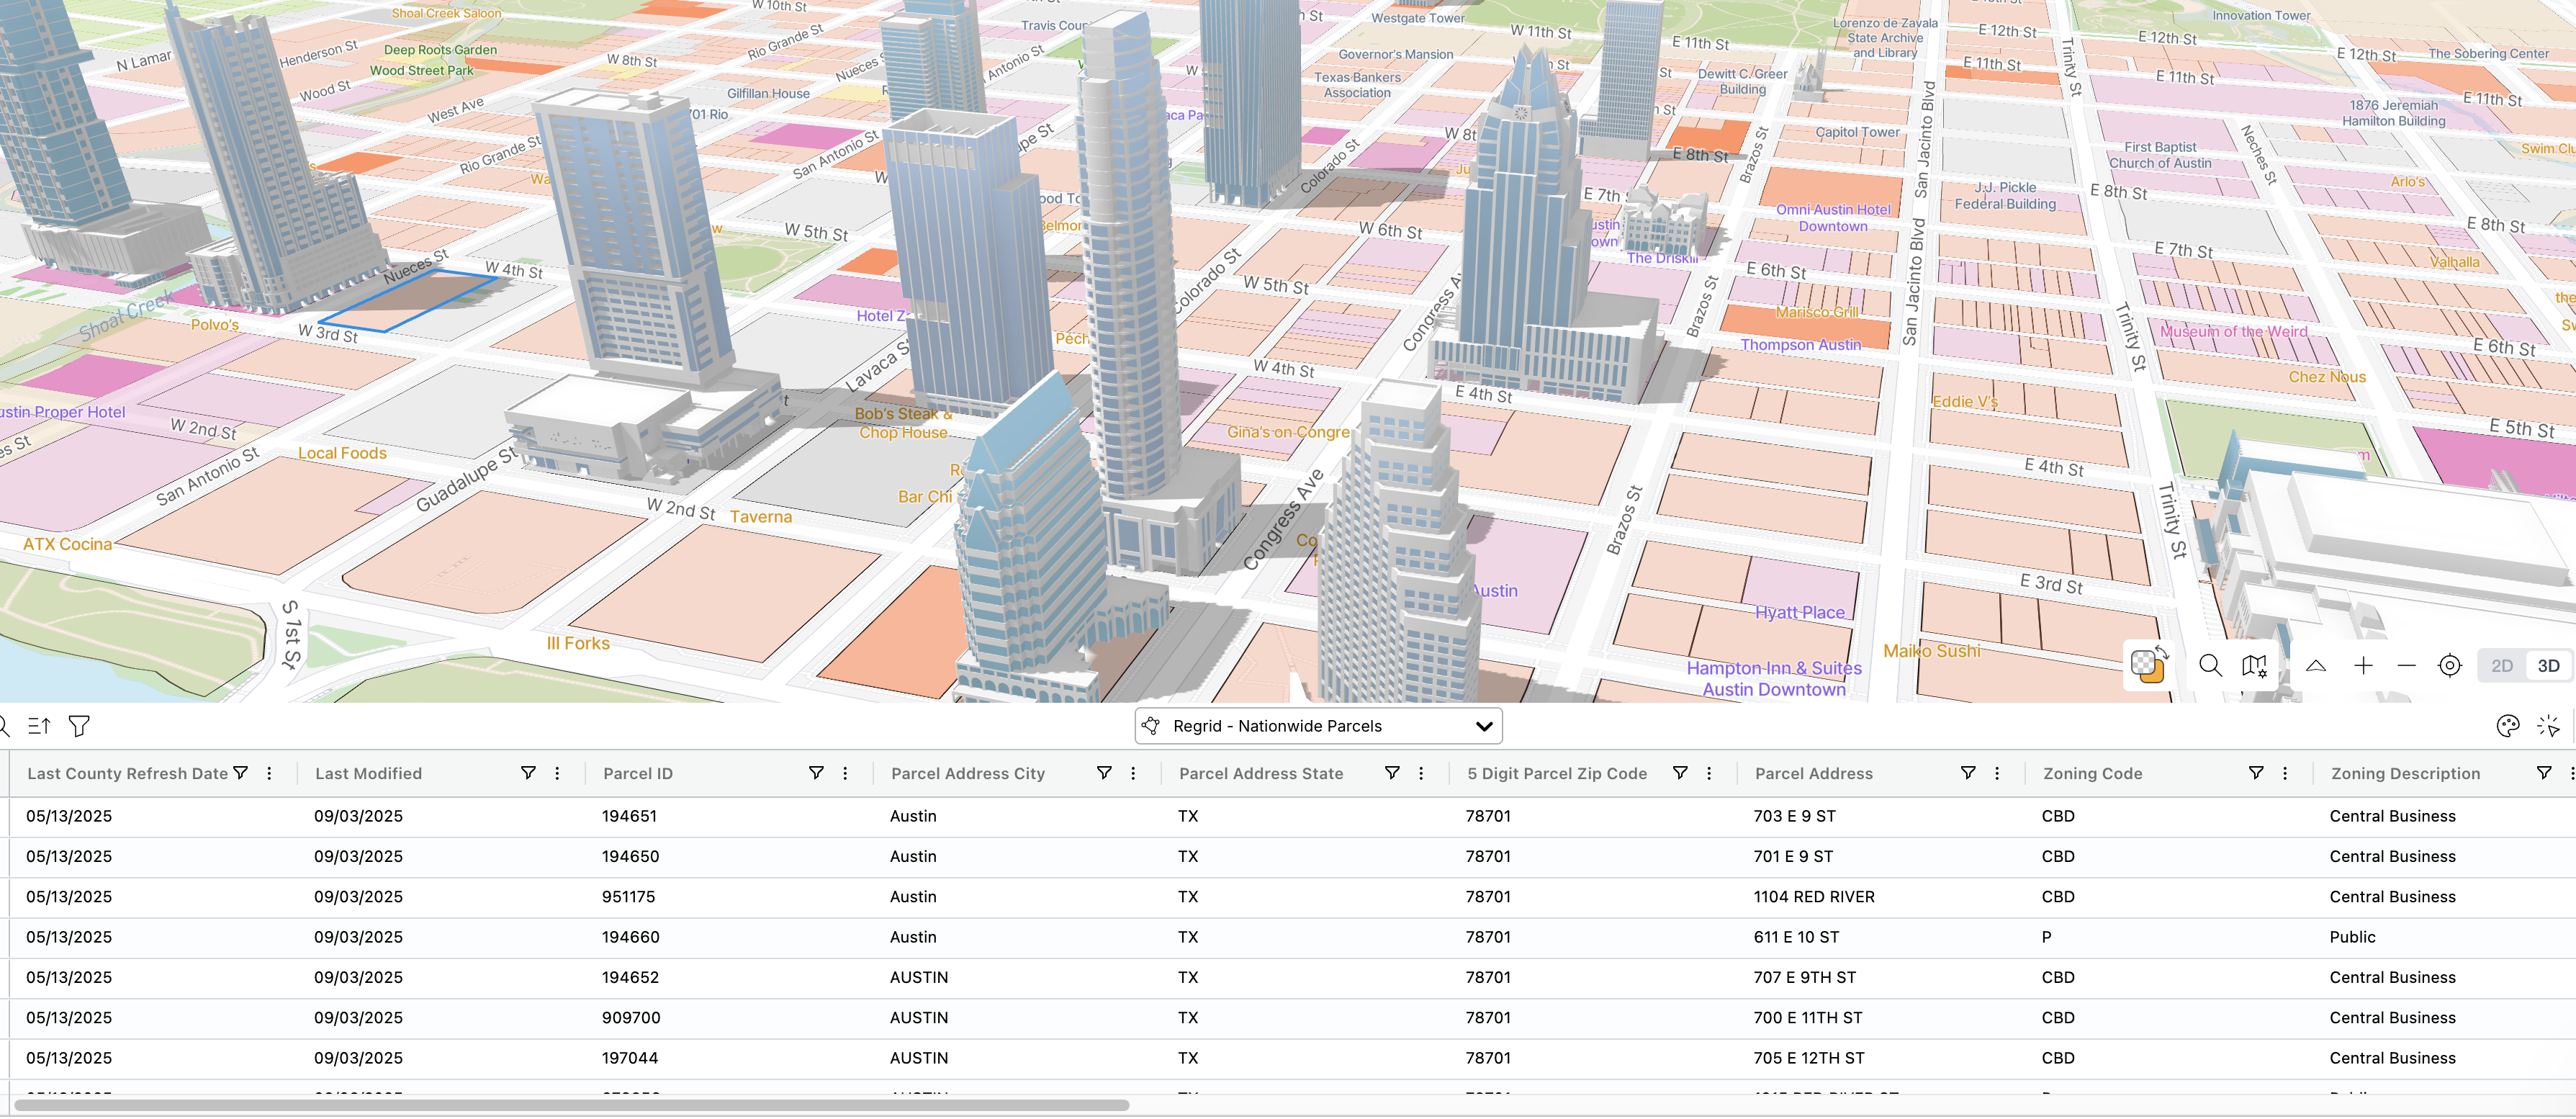
Put spatial data under a lens.
Giraffe ships with data management tools, out of the box.
Filter, style, extract and load.
Save filters, templatize data packs and share with your team or clients.
Giraffe Lens works on almost any vector data source whether it is open, proprietary (like Regrid) or self hosted.
.webp)
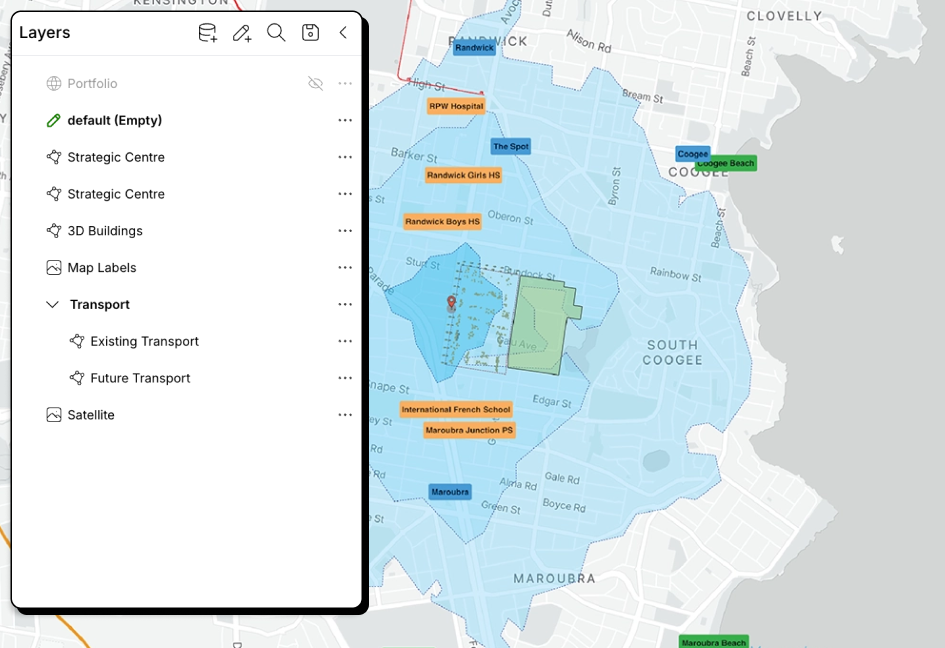
Organize - and make explicit - your assumptions
Development, design and planning are driven by assumptions.
Rent costs by the foot, or by the unit? Forecast uptake rates? Trips generated? Gross to net assumptions?
Giraffe Usages keep your assumptions organized within a project, or across a team via templates.
Customize them and use them to drive rigourous financial, economic or environmental modelling tied directly to the model.

Customize data outputs.
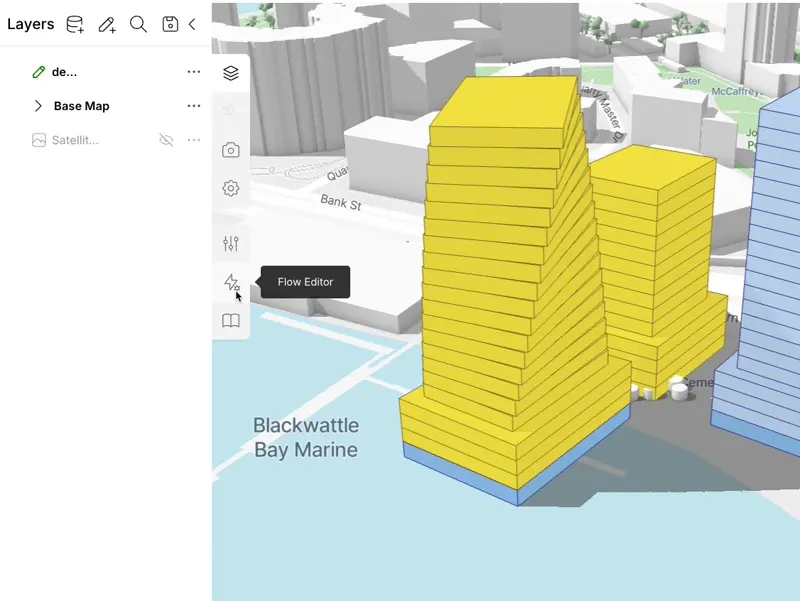
The Giraffe engine consumes data & assumptions and then uses them to produce data for decision makers.
You can customize how the data is transformed and reported using Giraffe Analytics.
← Here the user adjusts a measure, and then traces the result through the model.
.webp)


Site analysis done fast
Model scenarios to find the build program that will drive the highest return
At its core, Giraffe combines drawing and math.
Understand the impact of your design as you get real-time analytics while drawing. Standardize your business assumptions into templates: apartment sizes, construction rates, floor-to-floor heights, and building designs. Use them to create workflow efficiencies that allow you to focus on design iterations and optimisations.

Consolidate your market research and understanding onto one single map
Understanding your market and context is critical to making good investment and design decisions. Giraffe allows you to connect to any data source extremely simply. These data sources can be woven together into a single pane of glass that drives transparency and understanding across your business.
Data sources can be queried, filtered and visualised on the fly to drive analytics and avoid confusion. You can also host your own vector or raster data on the platform.

Aggregate data layers and filter based on your requirements
Finding development opportunities can be a major challenge. Data is localised and can be hard to contextualise - this requires a system that can integrate lots of data from different locations.
Giraffe allows you to connect to spatial data from any location. Filter, query and layer any data sets over the top of each other. Using the Lens tool you can build a customised site search tool that suits your needs in any location.

Trusted worldwide

Nettletontribe
The ease of creating 3D built form and real-time analytics made Giraffe the go-to tool for early-stage feasibility studies for nettletontribe.