
The fastest way to find, qualify and pursue industrial sites
Giraffe brings site and utility discovery, feasibility, and demand modeling into one workspace, so teams can move from regional investment thesis to viable opportunities in minutes.
What customers say
"Giraffe has been a total game-changer for us. I use it from the moment I find a piece of land — zoning, wetlands, elevations all in one place. What used to take a few weeks of back-and-forth with brokers and consultants now takes a few hours."
Jack Ross
Director, Investments - Summit Real Estate Group
"We were able to easily integrate the Giraffe technology into our current deal flow systems, which saved valuable time for all of our teams."
Dusti Wofford
Global Head of Digital & Technology Strategy, Trammell Crow Company
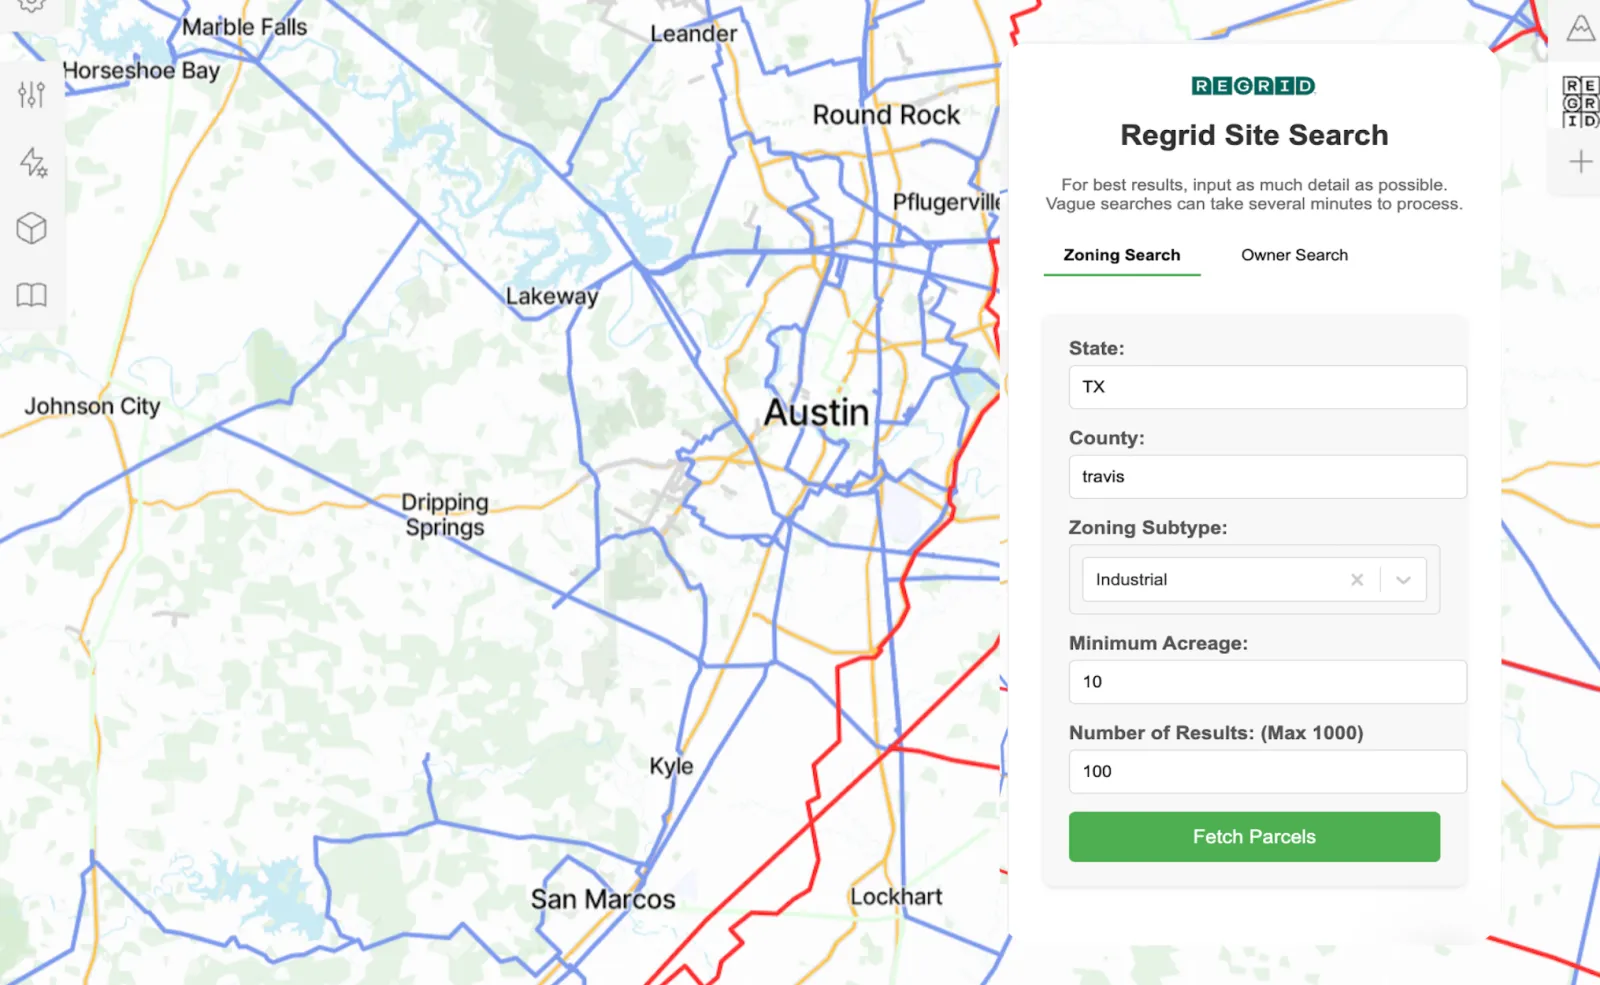
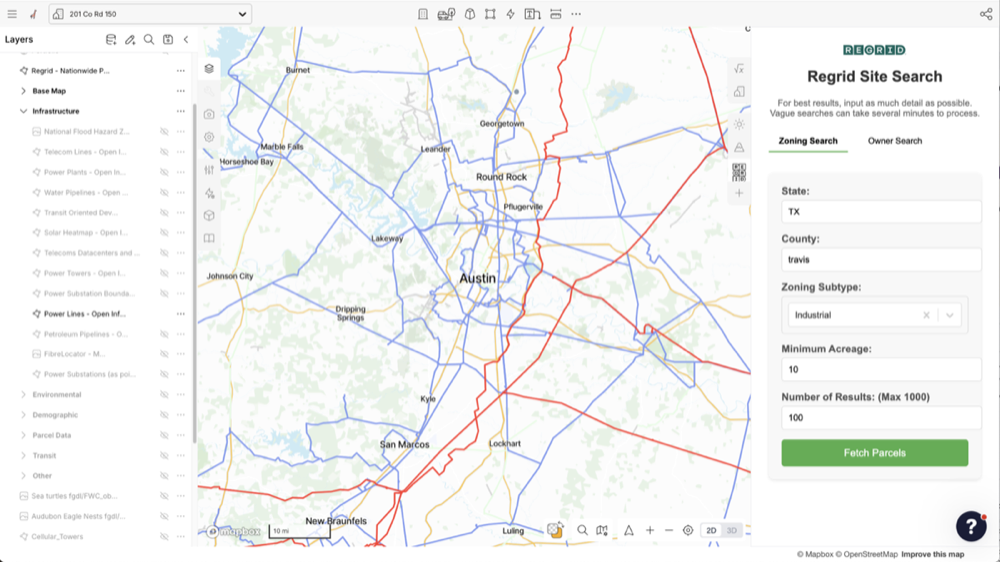
Giraffe connects you to county and nationwide datasets for site discovery—visualizing environmental layers (flood, wetlands, contours, soils), power capacity, water and wastewater systems, natural gas networks, fiber and broadband, and multi-jurisdictional utility boundaries. Integrated Regrid parcel data surfaces qualified sites fast.
See the infrastructure, find the sites
Giraffe connects you to county and nationwide datasets for site discovery—visualizing environmental layers (flood, wetlands, contours, soils), power capacity, water and wastewater systems, natural gas networks, fiber and broadband, and multi-jurisdictional utility boundaries. Integrated Regrid parcel data surfaces qualified sites fast.
Cut, fill and plan the site
Acquisition teams can model industrial programs, assess yield, and estimate horizontal volumes. Test pad configurations, compare building types (shallow-bay vs. rear-load vs. cross-dock), review site works, run yield scenarios, and export to architects and engineers. Your feasibility becomes a living, continually improving model—not a static PDF.
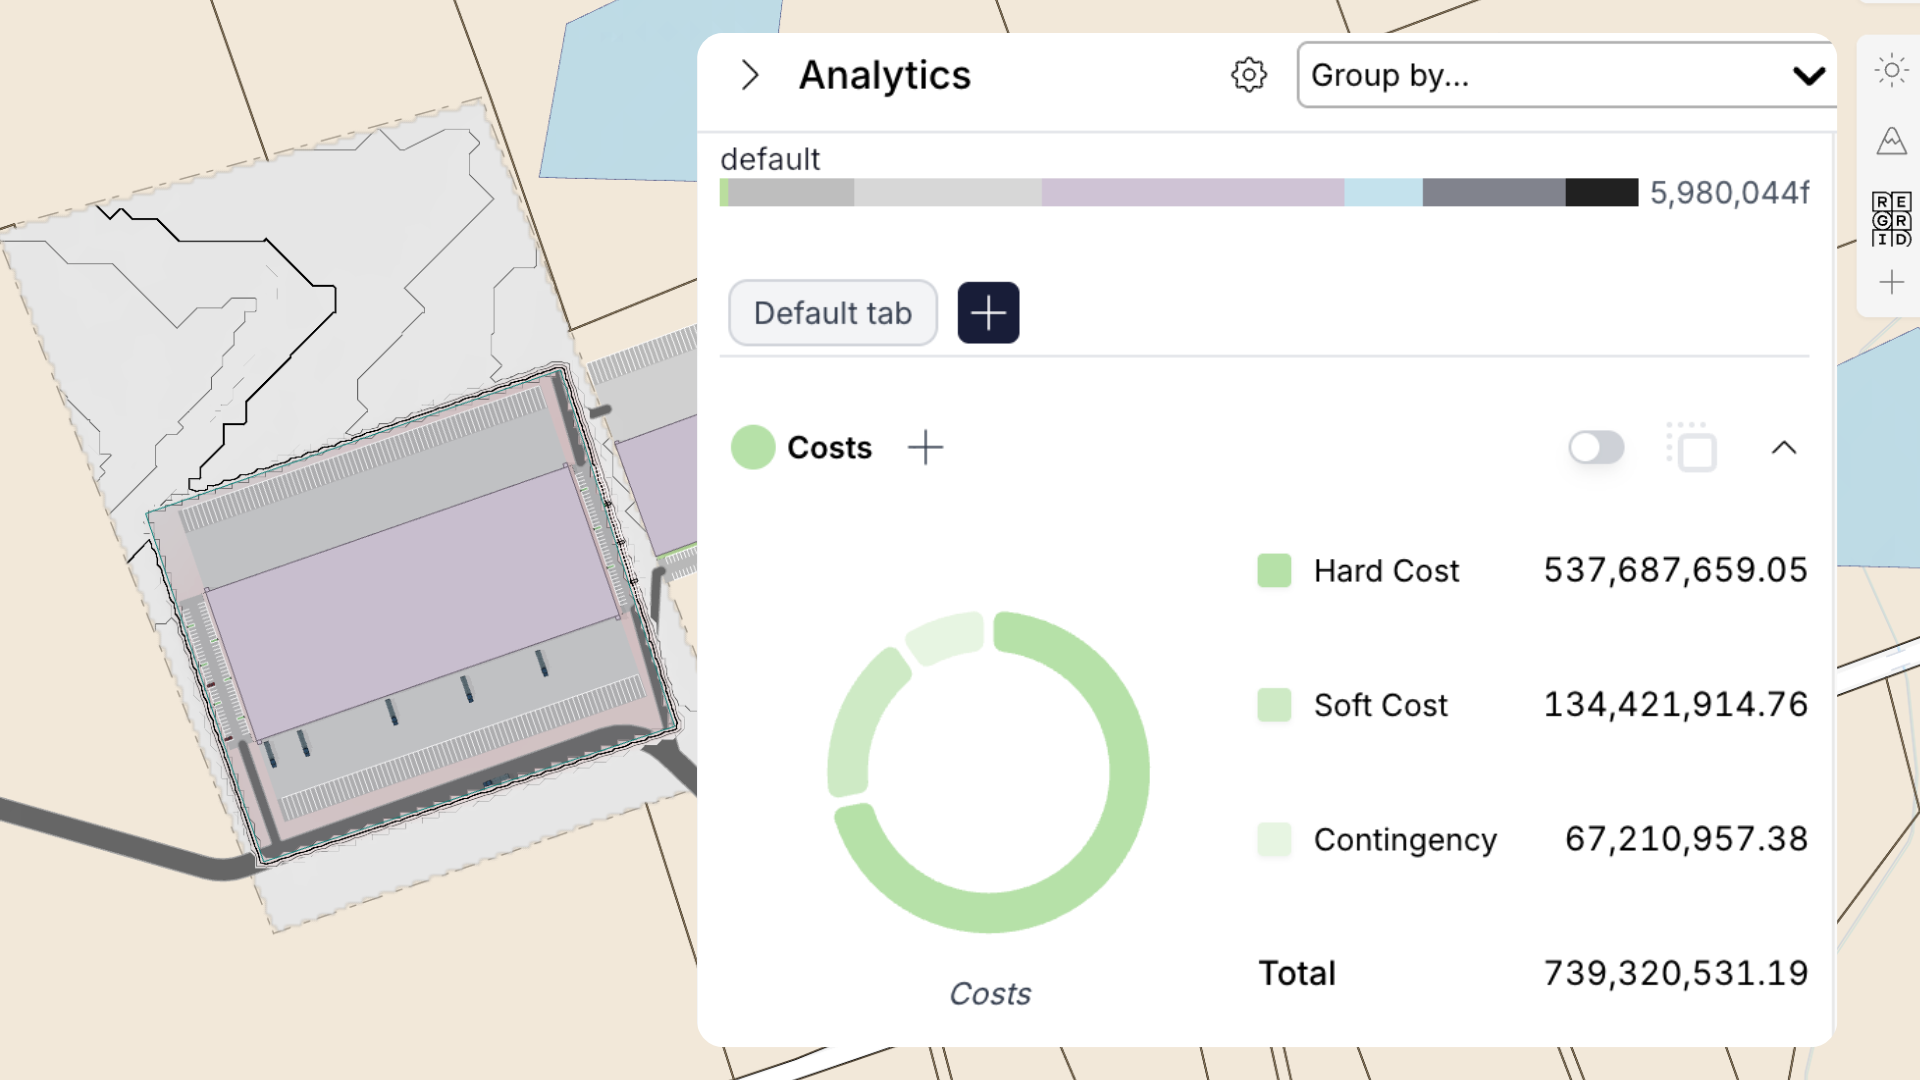
Estimate with confidence
Link takeoffs to rates and produce detailed cost plans organized to match your estimating process. Identify site prep and cut/fill areas, apply rates at any detail level, produce an auditable bill of quantities, run yield scenarios, and export to CSV or PDF. Templatize your work for instant feasibility and cost assessments.
Power. Policy. Infrastructure.
Regrid parcels integrated into FiberLocator's utility and infrastructure mapping give you complete data center and mission-critical site potential assessment from project start.
Giraffe is a tool, and a platform.
Giraffe is designed as a layered platform. Some teams start simple, others run their complex business processes on it. You can adopt Giraffe at the level that fits your business today, and grow into more over time.
Platform
Your core real estate operating system
A secure, globally-scaled platform for working with spatial data, workflows, and AI.
Built for developers, planners, designers, and analysts who want to move fast:
- Connect data layers and geometry
- Build and run apps and workflows
- Automate analysis and decisions
No credit card required. Start immediately.
Configured Data & Apps
Ready-to-use intelligence for real estate workflows
For teams that want value on day one.
We provide:
- Curated planning and market datasets
- Pre-built apps for feasibility, due diligence, site analysis, and more
- Ongoing training so your team becomes AI-enabled fast
You get the platform — plus proven workflows already configured.
Enterprise Decision System
Giraffe as a decision system across your organisation
For large developers, asset owners, governments, and consultancies.
We partner with you to:
- Integrate Giraffe into your digital & AI strategy
- Connect internal systems and proprietary data
- Build governed, repeatable decision workflows
- Automate high-value processes across teams
From pilots to organisation-wide transformation.
Training package: Finding Industrial Sites

James Blackwood
Chief Revenue Officer
Leads Giraffe's US growth with deep expertise in real estate finance, analytics, and development strategy. Instructs both the Mastering Multifamily and Finding Industrial Sites bootcamps, focused on data-driven site selection, feasibility assessment, and pipeline management.

Ian Mize
Principal Solutions Consultant
Over a decade of experience evaluating and designing multifamily and industrial sites across the U.S. Specializes in feasibility analysis, due diligence automation, land planning, and real estate data analytics. Co-instructs Giraffe's multifamily and industrial bootcamps.
Pricing
Pricing for the Finding Industrial Sites module (3 weeks).
Individual
$ 4,990 per seat
1 seat, 1-year Giraffe platform subscription, Regrid parcel/utility data access, Giraffe Mobile App, expert-led bootcamp, on-demand tutorials, 90 days onboarding support.
Team
Contact sales
Special rates for teams with available add-ons.