
Giraffe Design: designing the building, and the process that makes it
Twenty minutes on one site in Strathfield, from a loose sketch to massing, presentation and analysis. And the reason Giraffe is built out of boxes.
The problem, as we draw it
On the left you have some money. On the right you need a building. Getting from one to the other is extremely difficult.
It takes engineers, consultants, planners, government officials, financiers, agents, clients, architects and every sub-consultant, along with their computers, their data and their processes. Data gets lost between them. Lines break. Vendors build walled gardens, and consultants build business models where more complexity is better for everyone. It is slow, and it is chaos.
The result is that construction productivity has barely moved in decades. The Empire State Building was reportedly designed in two weeks and built in thirteen months, with no computers and no BIM. A modern building and the Empire State Building are much closer together than a Model T Ford and a Tesla Model Y.
Design one and design two
A car factory also turns money into a product. People are still involved, but walk through BMW in Munich or a Tesla Gigafactory and you'll see fences everywhere. The robots, the stamping machines and the car bodies moving down the line are inside. The people are outside, designing and running the line.
That's the difference. Design one is the thing: the building, or the car. Design two is the process that produces it. Manufacturers spend a great deal of time on design two, and it pays them 2–3% more productivity every year. Year on year on year, that compounds massively.
You're designing the system by which you do the designs.
Think of a surgeon with a robotic arm. Their fingers no longer hold the scalpel. They hold a control, which holds a robotic finger, which holds the scalpel. That's why they can work through a keyhole, and why you walk out the same day with no scar. Degrees of separation and abstraction make things more complicated, but they make them far more efficient.
Why Giraffe is a set of boxes
Automation needs boundaries. You need flexibility, but with boundaries. So Giraffe is built from boxes. We call the system Mondrian: boxes that nest and compose without limit, but boxes all the same. You can't get a triangle in Giraffe.
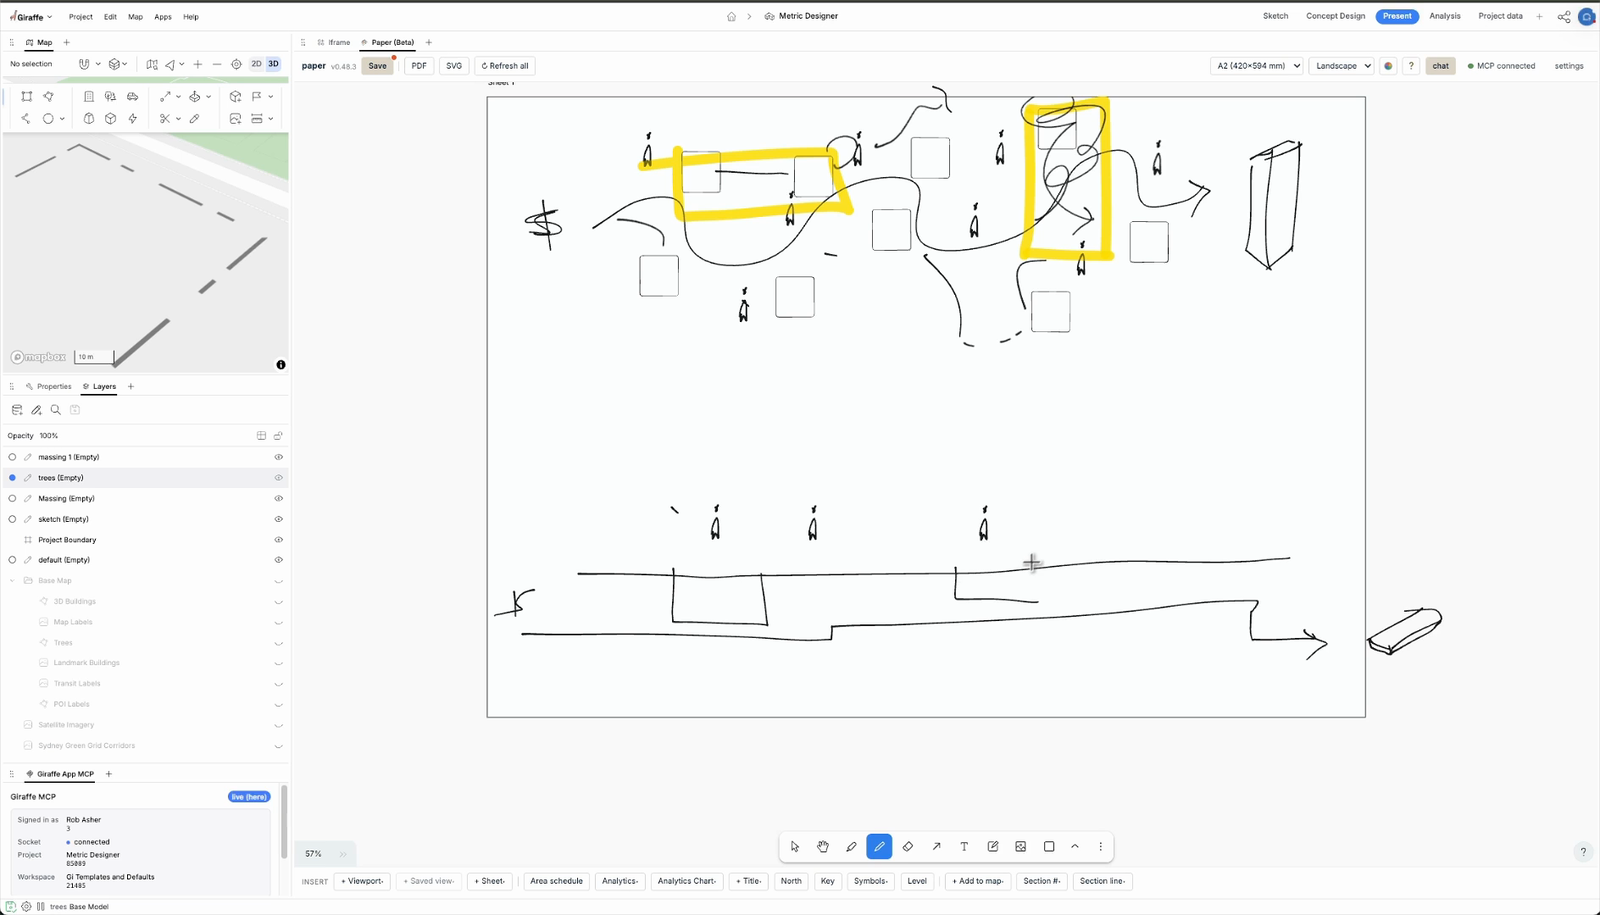
Each box describes a workflow. A presentation box holds the Paper app and the map side by side. An analysis box holds the map, the 3D view and the spreadsheet. Project data has no map at all; it's the BIM manager's delight. Connect the boxes and you have a process: sketch, then concept design, then presentation. If that's not how your office works, build your own.
Because the process is split into steps, you can automate it piecemeal. You might sketch by hand for as long as you like, while the apartment layout downstream is automated. Over time you automate this step, then that one. Same process, accelerated, slowly but systematically.
If you like designing the process, Giraffe is a lot of fun. If you just want to open SketchUp and start extruding, it can look overcomplicated. Both are valid. Process design is where the productivity is.
The practice: the standard Giraffe Design workflow
1. Sketch
A client calls a director at an architecture firm. The first thing they want to do is turn on the buildings and the site and start sketching. There's a big building over there. That's a park. Here's Strathfield Sporting Club, so we'd better mark that as important. Maybe we connect these two things. Maybe the traffic can drive some retail along this frontage. There's room for a small forecourt here.
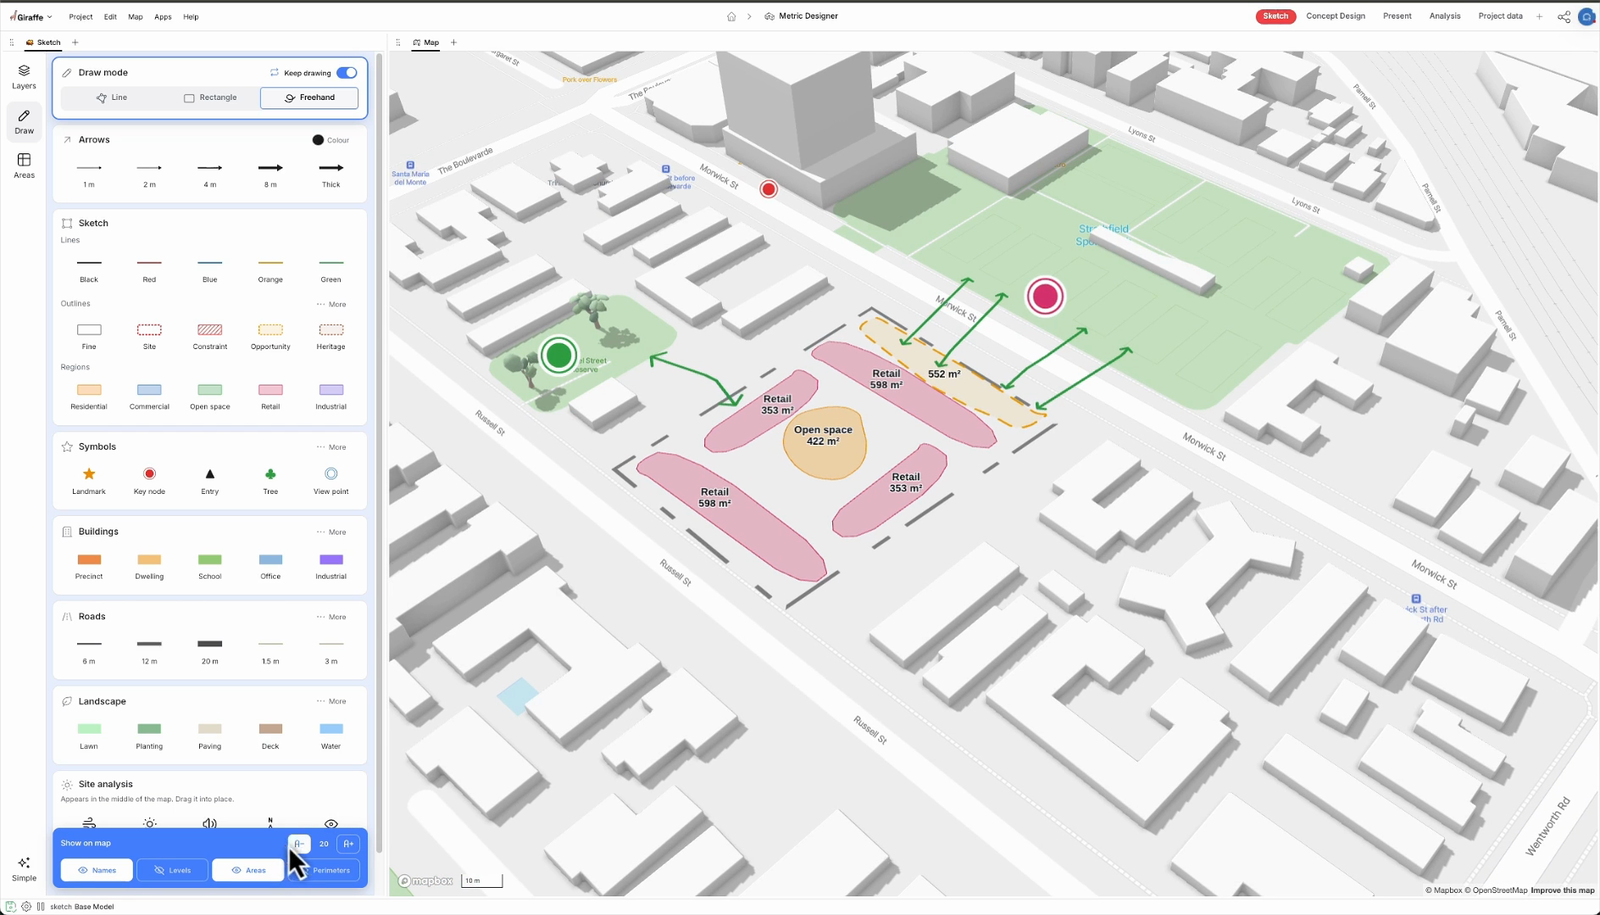
Giraffe's job here is minimal. There's no AI, just data. We exist to help you see. Because it's in a computer, you can switch the areas on and see roughly 1,900 m² of retail. But mostly, this is a very human step.
2. Concept design
Move to concept design and different tools appear: a layer menu and drawing tools. Now you're drawing precisely, but still loosely. Retail exactly 14 m deep. A cut-out for the plant and core. Then residential on top, using an apartment algorithm that places the cores and lays out the units.
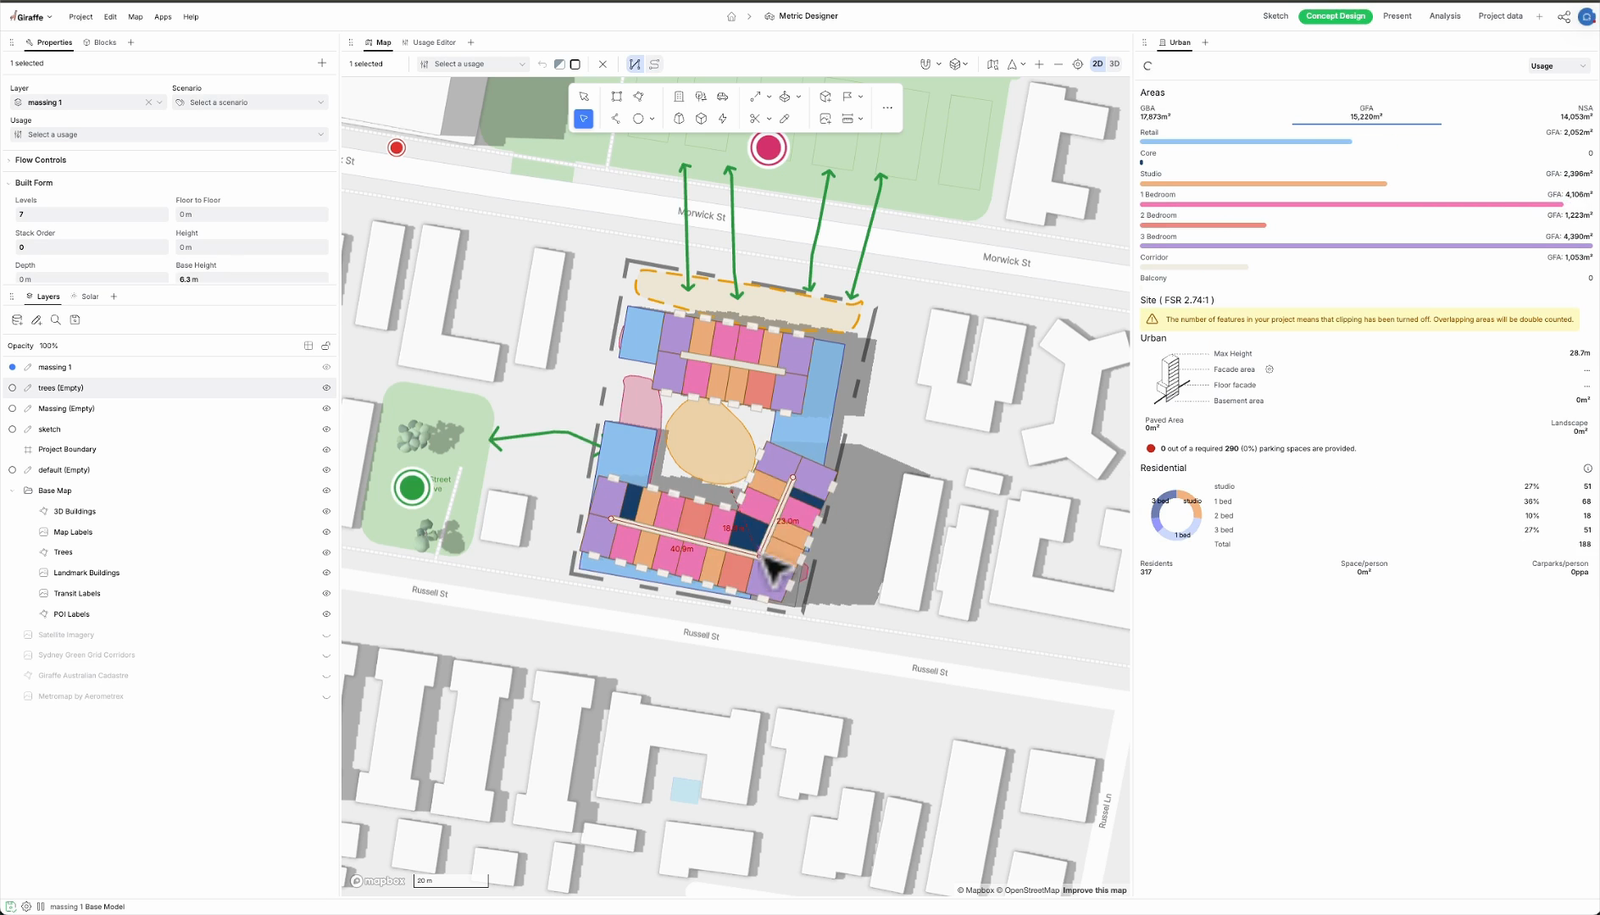
This might be a different person from the one who sketched, or the same person wearing a more technical hat. There are a lot of parameters here, used to work competently with the algorithms.
3. Presentation
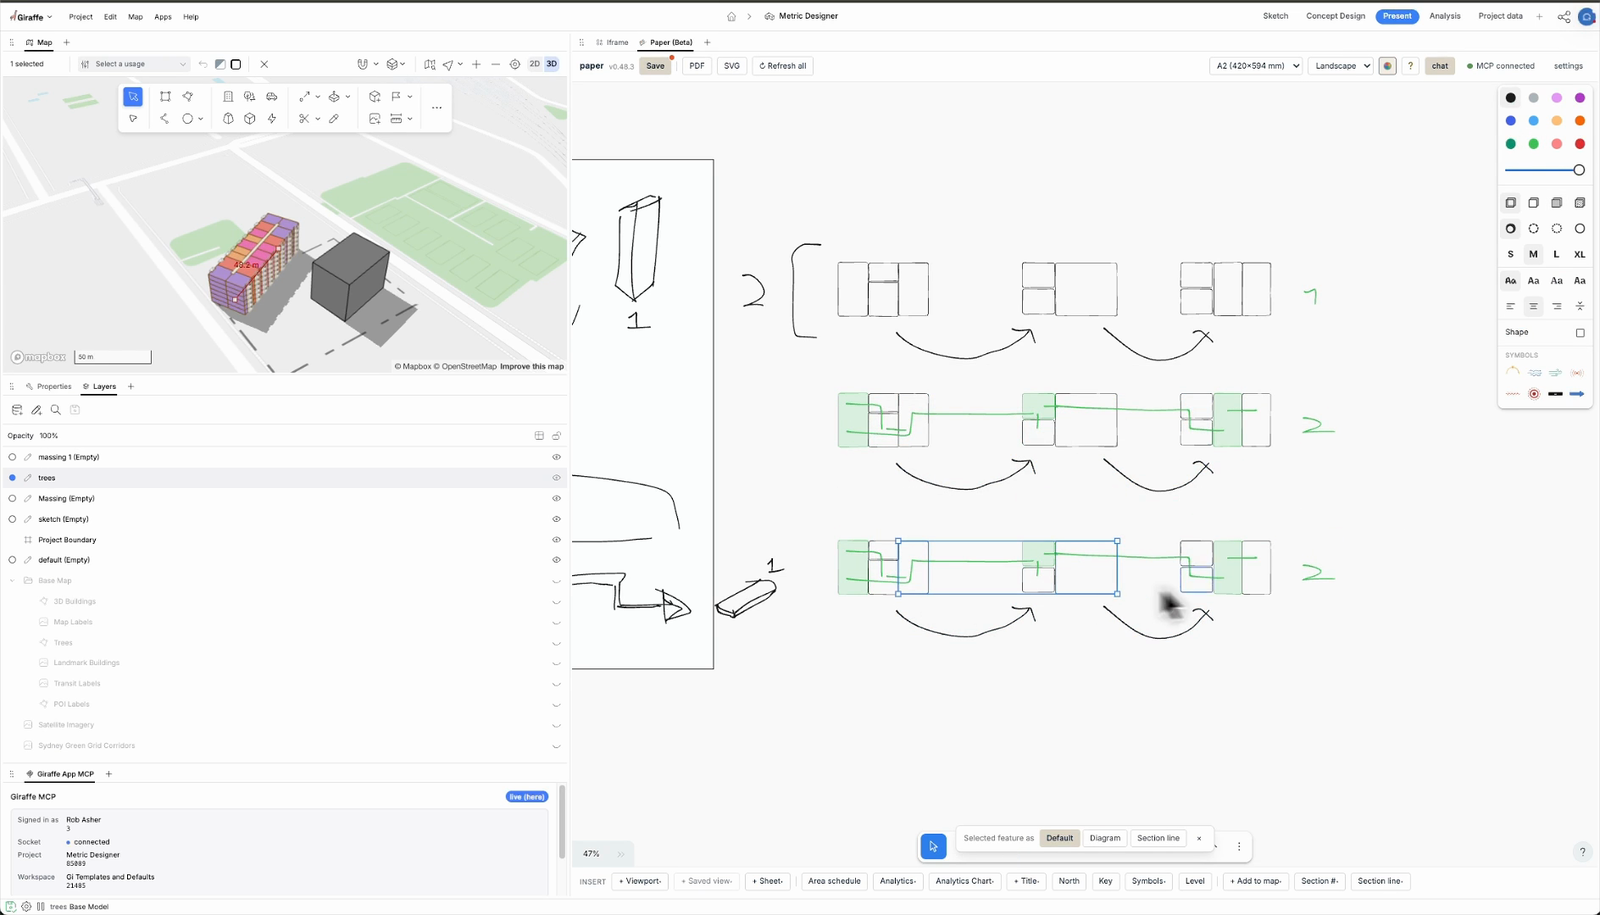
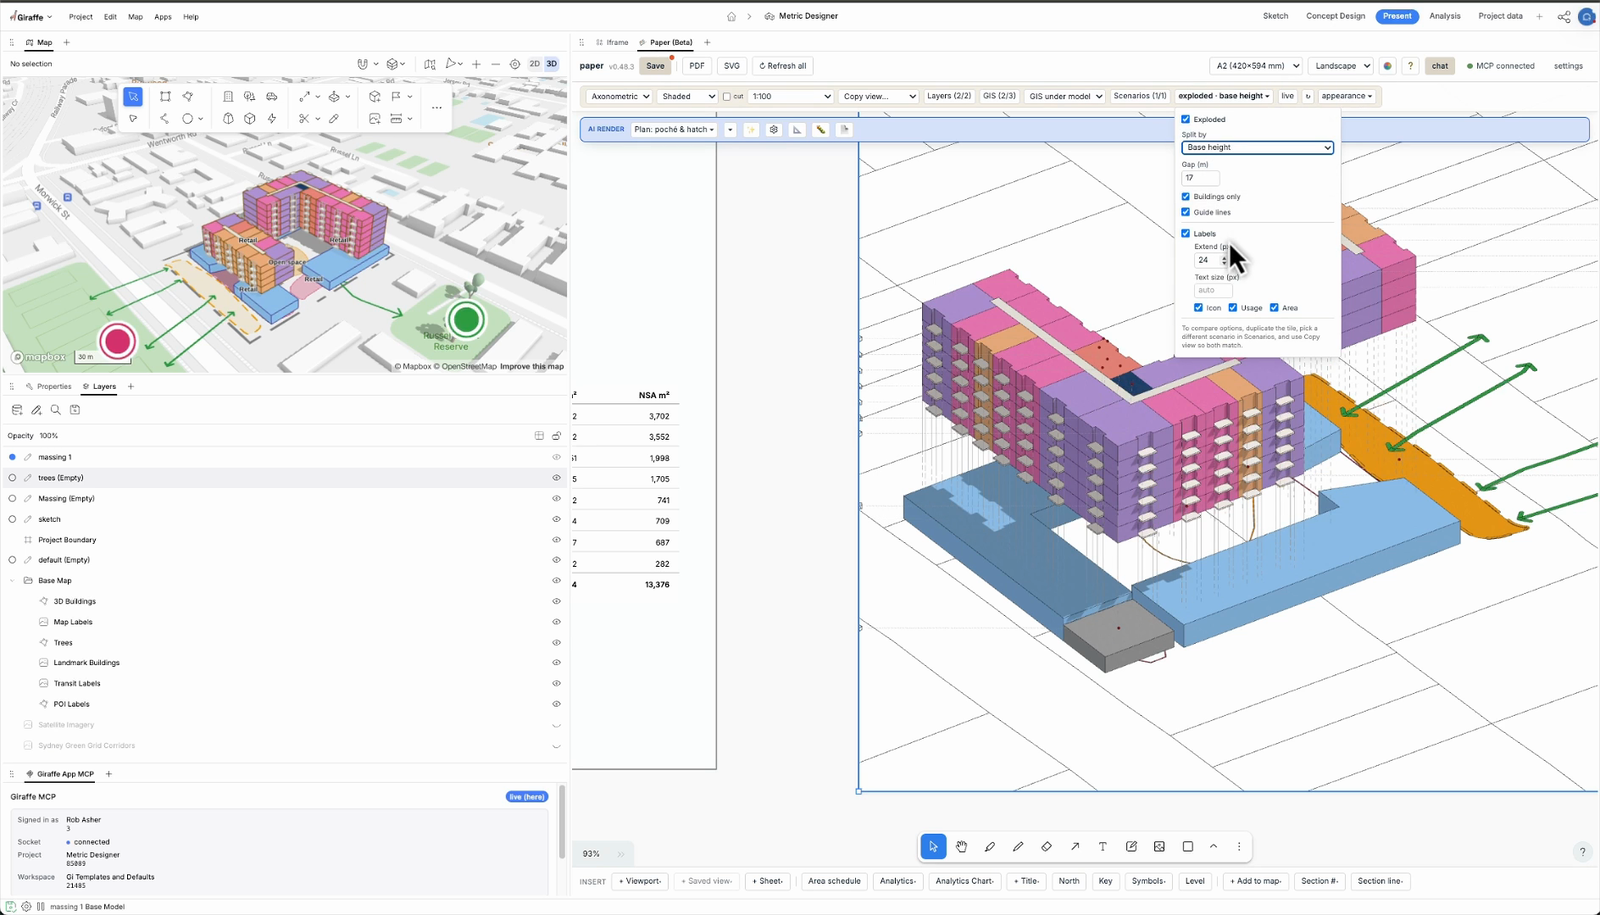
Next comes presentation, where you might be working as a graphic designer rather than an architect. Drop a 3D sheet into Paper, switch to plan for a figure-ground, bring in an area table, or explode the axonometric.
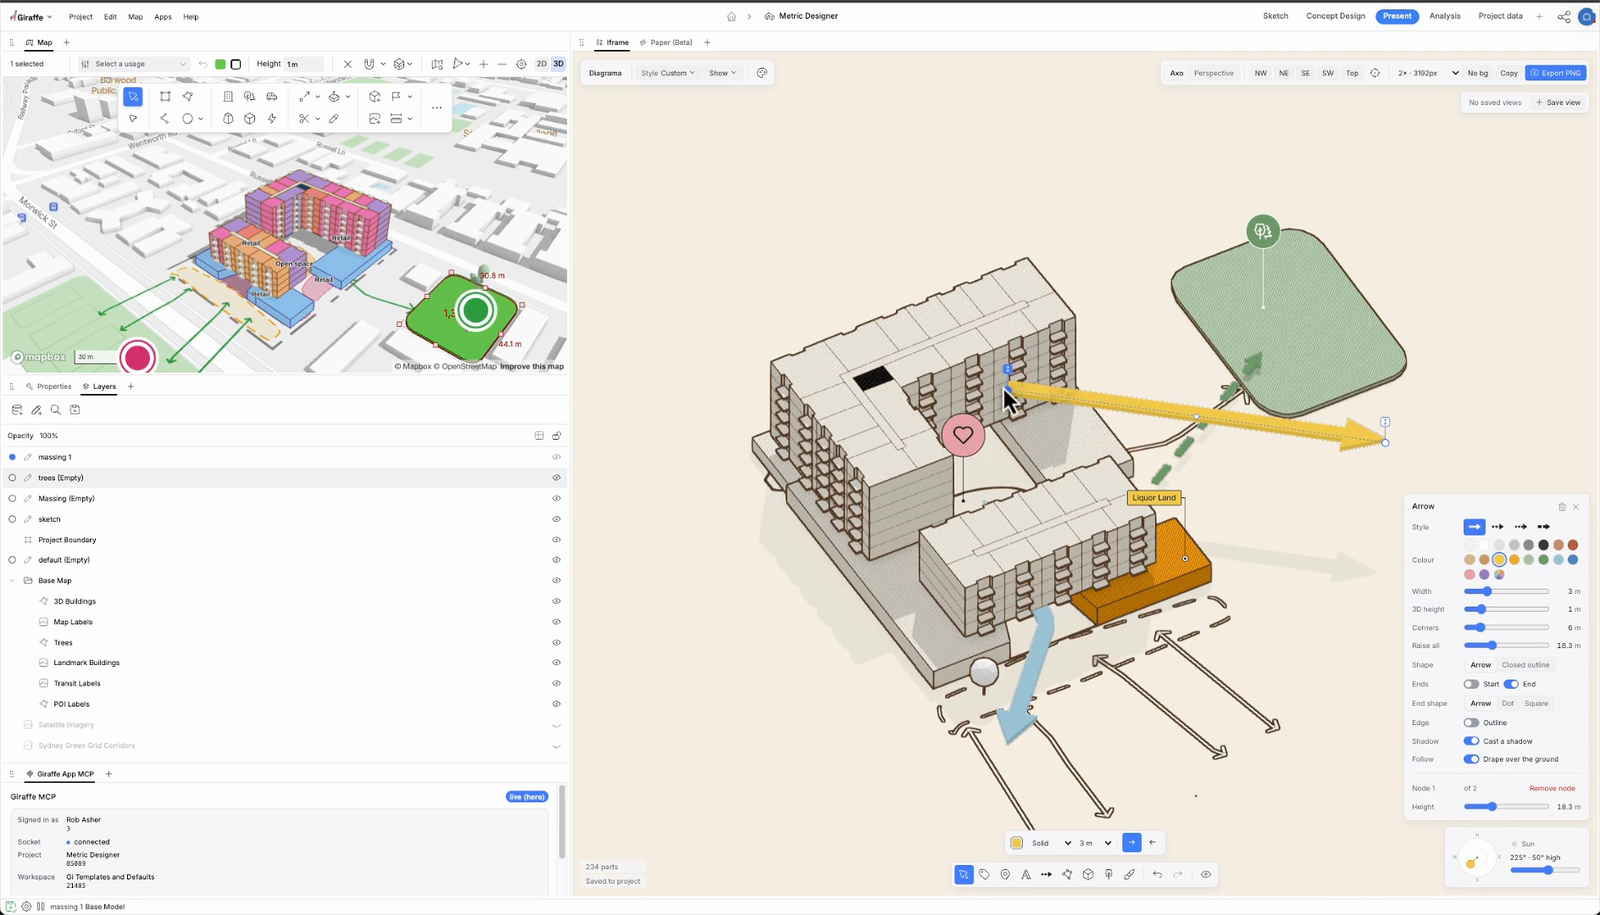
Then there's another small, powerful automation: a diagram maker. It's an app I built that day, running inside Giraffe as an iframe.
4. Analysis
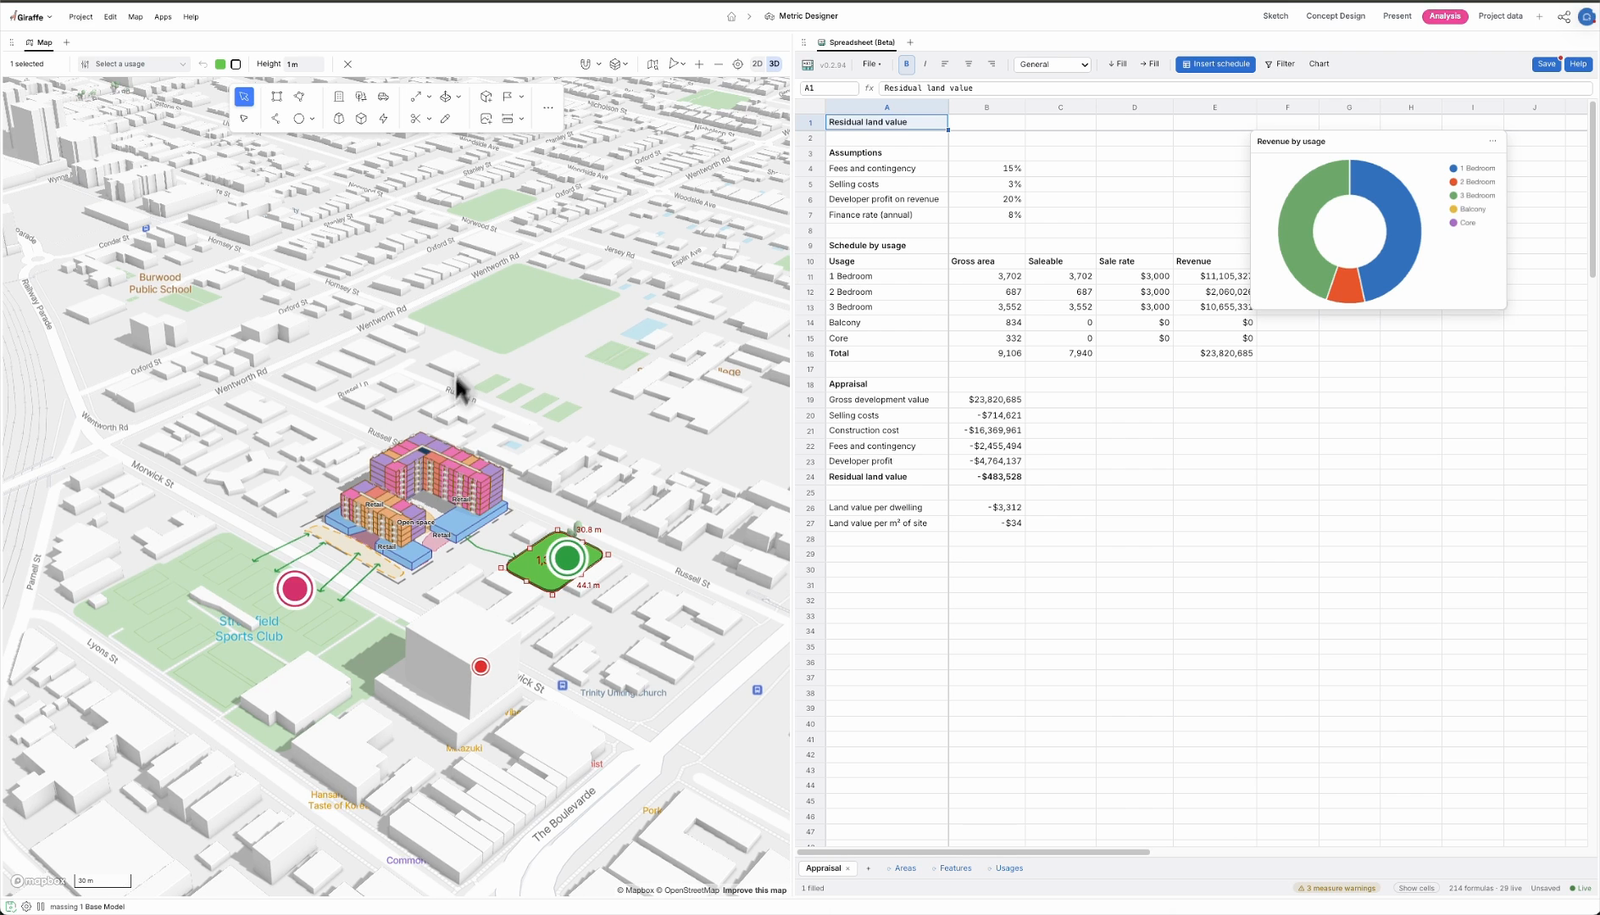
Finally, analysis: a different user, a different workflow and a different set of tools. The map, the model and the numbers, all in one place.
Twenty minutes, mostly in silence
That was about twenty minutes of work, most of it in silence: drawing, thinking, presenting. It was data-driven, with every assumption standardised and all the mapping and geospatial work done. It was also very human, because the sketching, the design and the concept were all mine.
The workflow I showed is my design. Yours can be different. You can build one that reflects how your firm actually works, quickly, the same way I built the diagram maker that day. Your design two might look nothing like mine, and that would be excellent.
What we want to see is diversity: processes tuned to different product types, markets, cultures and places, but each structured so it can keep getting more productive.