
Site analysis, master planning and area calculations in one tool
Disconnected workflows are a pain: copying data from CAD to spreadsheet to presentation to 3D model causes errors and wastes time. Giraffe connects those workflows in one tool and eliminates the manual work.
What customers say
"Giraffe isn't just about making something look good—it's about a fundamental shift in how we approach and think about urban design."
Sheba Ross
Global Practice Director - Cities and Communities, HKS
"The drawing tools make it easy to iterate rapidly and get metrics instantly. Immediate context is always there—critical for early stage design."
Mitchell Axisa
Digital Design Manager, nettletontribe
"We rapidly reduced time and improved quality of built form mapping, hosted spatial layers in a browser, and use a vast array of flexible features."
Liam Walsh
Director, Sustainable East
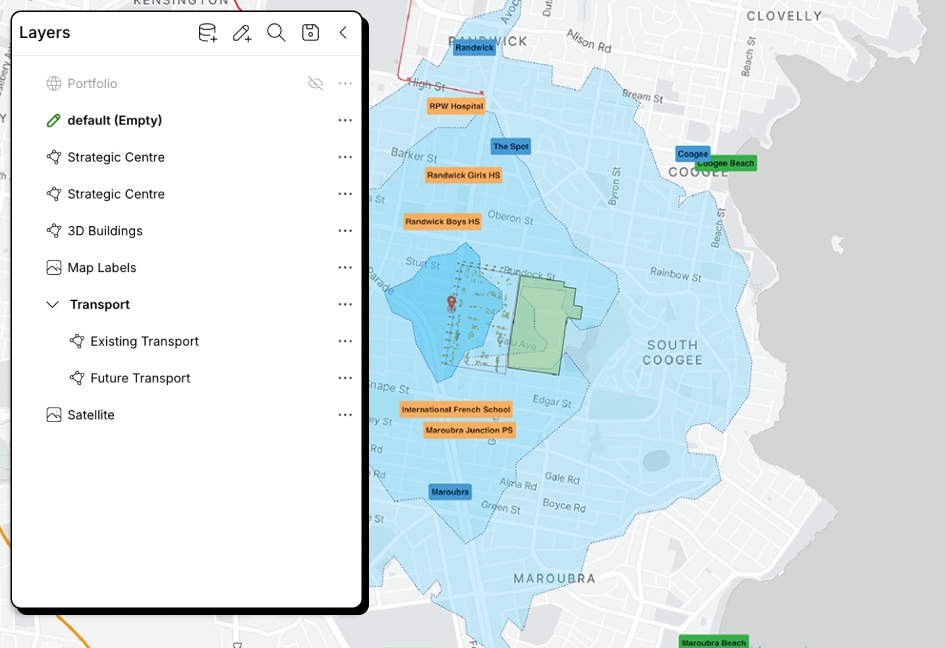
Site analysis is impossible without context data. Giraffe is built on a map of the world, so you are always in context. Search the data library to add thousands of layers from around the world to your project—zoning, parcels, contours and more from hundreds of cities. And it's easy to add your own.
Design in context
Site analysis is impossible without context data. Giraffe is built on a map of the world, so you are always in context. Search the data library to add thousands of layers from around the world to your project—zoning, parcels, contours and more from hundreds of cities. And it's easy to add your own.
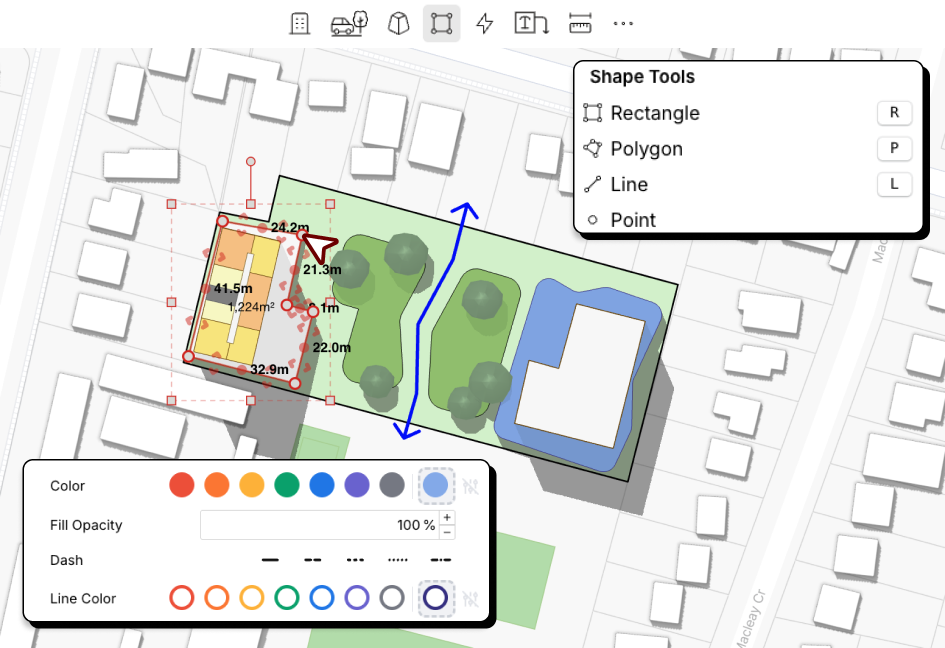
Draw right on the map
Using familiar tools you can diagram, design and annotate on the map. Master plans, test fits, site analysis—Giraffe makes it simple and graphical. Grid snaps, direct dimension inputs, drawing layers and rich graphic options allow you to create your own style. Giraffe turns 2D shapes into 3D buildings: just add levels.
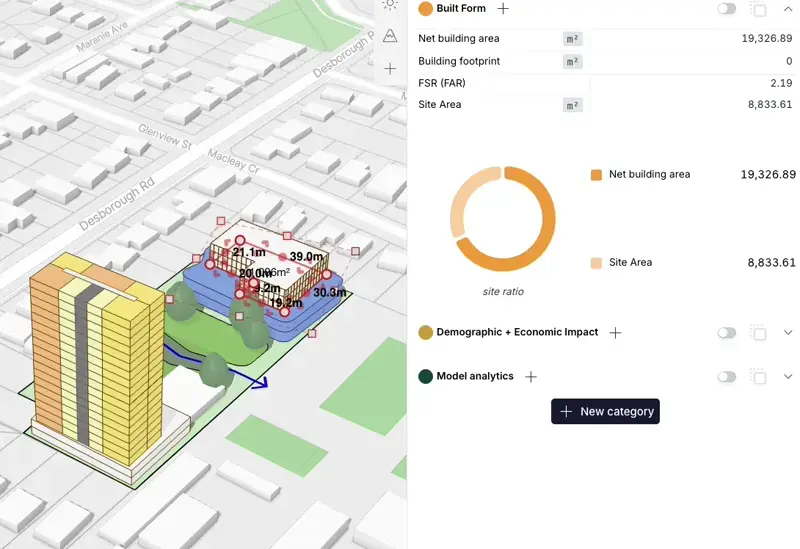
Giraffe does the numbers for you
Your assumptions—like efficiency, or floor-to-floor height—and your design feed Giraffe's calculation engine. Define your own calculations and assumptions with an Excel-like syntax. Giraffe keeps the model and the assumptions in sync with the outputs, and presents it clearly.
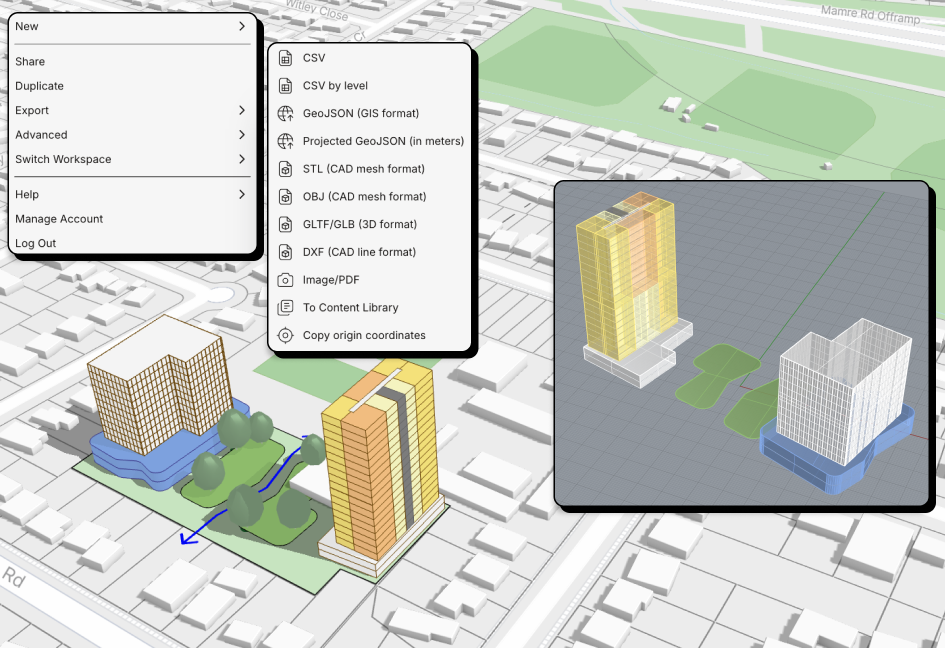
Built to interoperate
Giraffe is designed to complement the rest of the tools in your office. The core data structure is GeoJSON—human readable and machine readable by GIS tools, Python and JavaScript. Export to STL, OBJ, DXF and IFC. Import CAD, PDF, images and survey data.
Giraffe is a tool, and a platform.
Giraffe is designed as a layered platform. Some teams start simple, others run their complex business processes on it. You can adopt Giraffe at the level that fits your business today, and grow into more over time.
Platform
Your core real estate operating system
A secure, globally-scaled platform for working with spatial data, workflows, and AI.
Built for developers, planners, designers, and analysts who want to move fast:
- Connect data layers and geometry
- Build and run apps and workflows
- Automate analysis and decisions
No credit card required. Start immediately.
Configured Data & Apps
Ready-to-use intelligence for real estate workflows
For teams that want value on day one.
We provide:
- Curated planning and market datasets
- Pre-built apps for feasibility, due diligence, site analysis, and more
- Ongoing training so your team becomes AI-enabled fast
You get the platform — plus proven workflows already configured.
Enterprise Decision System
Giraffe as a decision system across your organisation
For large developers, asset owners, governments, and consultancies.
We partner with you to:
- Integrate Giraffe into your digital & AI strategy
- Connect internal systems and proprietary data
- Build governed, repeatable decision workflows
- Automate high-value processes across teams
From pilots to organisation-wide transformation.
Training package: The Agile Architect
Adam Hogan
Customer Success Manager
Former architect with nearly a decade designing multi-residential projects across Queensland and New South Wales. Helps planners and developers turn complexity into clarity—connecting zoning, design, and data in real time. Holds a Master of Architecture and instructs The Agile Architect bootcamp at Giraffe Academy.